L&D Reports: 5 Simple Tips to Build Stakeholder Trust

There comes a point in almost every L&D initiative when the course is finished and the budget has already been spent. At that point, the real question becomes: what did the business actually gain from it?
That’s usually when reporting gets tricky. The natural reaction is to show more charts and numbers. However, more data doesn’t always make the report stronger.
In this article, we’ll examine five ways to present completed training so the business can understand its value and decide what to do next.
If you want a ready-to-edit template, download this free L&D Executive Summary Report. It’s a PowerPoint deck with guided prompts for each slide that will help you report any L&D initiative clearly and connect its results to business impact.
How to Make an L&D Report Credible to Business Stakeholders
Before we get into the five tips, one thing is worth mentioning.
A credible L&D report starts before the training launches, so you need to capture the baseline early: the business’s problem, current performance, manager observations, and the metric that should change if the program works.
Otherwise, once the course is finished, you might have completion data but no clear baseline. Without a starting point, it becomes much harder to demonstrate how training influenced business outcomes.
1. Anchor the report in a business problem
If your report starts with “We trained 1,200 employees,” L&D is already framed as a service function that delivered a request. Start one step earlier: what was happening in the business that made training necessary?
Name the business situation first: reduced conversions, rising error rates, slow ramp-up, safety incidents, low adoption of a new process, or inconsistent service quality. Then show the capability gap behind it.
Weak: We launched a sales enablement course for 1,500 reps.
Stronger: Conversion dropped from 21% to 16% after a product rollout. Reps struggled to explain the new value proposition, so training focused on discovery and positioning.
This helps stakeholders judge the report against the problem that training was meant to influence, not against the activity alone.
2. Don’t mix reach and impact
Completion rate, coverage, attendance, drop-off, and regional participation do not represent business impact on their own. This is the context that helps you understand whether the program had enough exposure to judge the results fairly.
If you deliver training through an LMS, this part becomes much easier to prepare. In iSpring LMS, 25+ real-time reports help you see both the overall rollout picture and detailed progress by learner, team, department, or location.
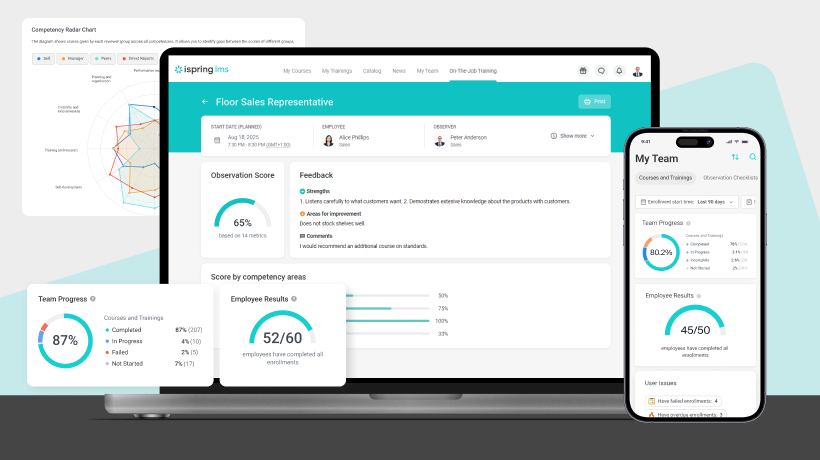
You can also review content-level statistics and engagement patterns to see where learners move smoothly and which parts of the program might need updates.
For training managers, such LMS reporting turns reach data into more than a completion snapshot. You can show whether the training effectively reached the intended audience, where participation dropped, and whether weak business results might be linked to rollout quality rather than the training itself.
3. Connect training results to business metrics
Don’t try to prove training value with learning metrics alone. Show how one logically influences the other.
For example, let’s say you trained the sales team. Connect course results, such as final exam or role-play scores, to real business metrics that matter to the company: close rate, conversion rate, average deal size, or sales cycle length.
For that, you need workplace evidence. It might be manager observations, call reviews, CRM notes, coaching records, completed tasks, quality checks, safety inspections, or customer service audits.
iSpring LMS can help capture this layer through the on-the-job training module. Supervisors can observe employees in actual work situations, check whether they follow required procedures or apply new skills, leave feedback, and store the results in the LMS.
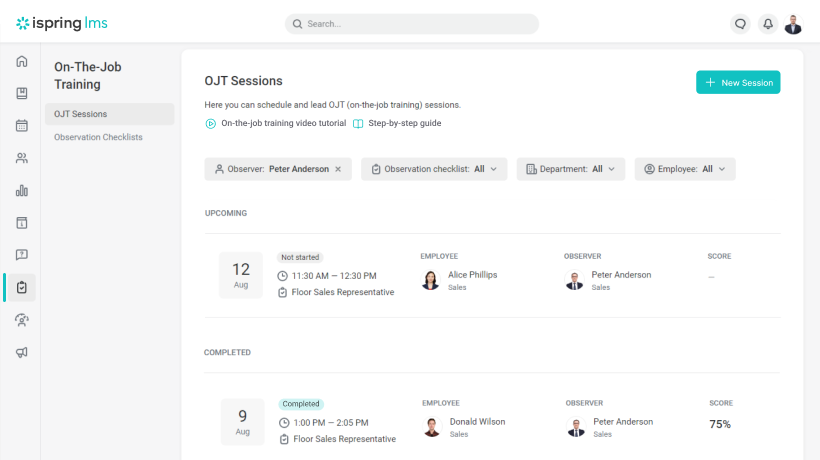
For the report, this creates a stronger chain of evidence: course score → observed workplace behavior → business metric.
4. Use performance gaps to strengthen the report’s credibility
Avoid framing the report as a purely positive outcome. Show where the program worked well, where it didn’t, and what you learned from it.
For example, if frontline teams showed lower participation and slower progress, say that. Then explain what may have affected the rollout, such as limited desk time, shift schedules, poor access to a stable internet connection, or content that wasn’t convenient to complete on mobile devices.
This does two things. First, it protects L&D from overclaiming results. Second, it turns a weak spot into a practical improvement for the next program. For example, if access was the issue, the next rollout may need better mobile learning support with the option of taking courses even when offline.
5. End with recommendations
End with 2–3 specific recommendations tied to what the data showed. Keep them practical enough to approve, reject, or assign. For example:
- If one region had lower participation, don’t just note it. Recommend a different delivery format or schedule for the next rollout.
- If learners kept missing the same quiz questions, recommend updating that section of the course or adding a short practice activity.
- If employees completed the course but managers didn’t see a change in behavior on the job, recommend follow-up tasks, coaching, or manager check-ins.
If the report shows that manager support drives better outcomes, learning reinforcement shouldn’t fall entirely on L&D. Keep managers involved while the learning is still happening.
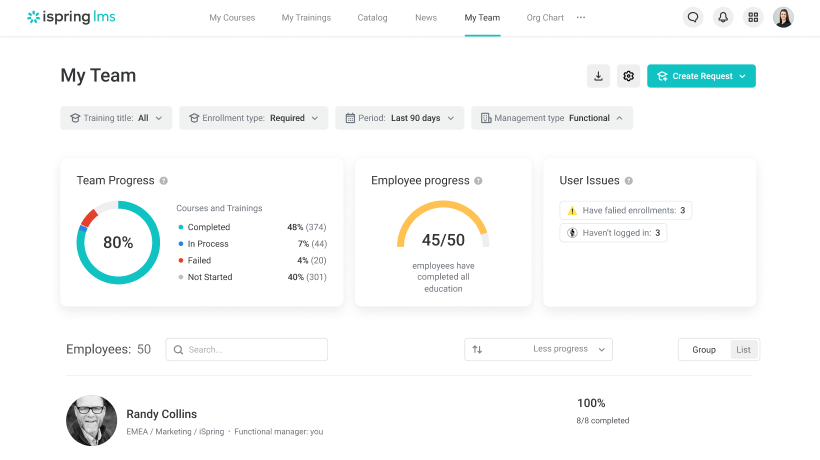
In iSpring LMS, that’s very easy with the dedicated Supervisor Dashboard. It gives managers visibility into team progress and individual results, so they can see who is falling behind, where support is needed, and what actions to take before the program ends.
Make L&D reporting easier with the right LMS
A good L&D report doesn’t need to prove that every part of the program worked perfectly. It needs to help stakeholders understand what the evidence says, where the results are strong, and what should happen next.
If preparing each report means chasing data across spreadsheets, managers, and disconnected tools, it’s a sign that reporting needs a stronger data foundation.
iSpring LMS helps you manage training, track progress, collect evidence, and keep learning analytics in one place, so stakeholder reporting becomes easier to prepare and trust.
Book a personalized consultation to discuss your training challenges, explore iSpring LMS capabilities for your needs, and see how it can support your L&D workflow.